Bitcoin has stopped falling through open space and started pressing against the bottom of its own recent range, while traders betting on further falls continue to pay traders waiting for a rise. That pairing turns a familiar slide into a test: whether the floor that held over the past twenty days holds again, or gives way under the same pressure that brought the price to it.
EVEDEX, a derivatives venue, recorded that close at $63,037 on 18 November 2026, in figures published the following day. Coinbase Exchange, a separate spot venue, put the same day's close at $62,982, a gap of +0.1% against the derivatives price. The two venues therefore describe the same day in almost the same terms, and the difference between them is smaller than the move that produced it.
The slide has reached the bottom of its range
The previous session closed at $64,921, so the latest session removed 2.9% in one day. Seven days earlier the price was $73,980, down 14.8% over that week. Thirty days earlier it was $81,902, down 23.0% over that month.
Over the twenty days before the latest close, trading ran between a high of $81,952 and a low of $62,018. The latest close sits 5% of the way from that low to that high, close to the floor rather than the middle. It also sits 13.4% below the twenty-day average close of $72,756.
A price that far below its own recent average is not a normal wobble around a settled level. It shows sellers have set the terms for most of the past month, and buyers have not yet reclaimed the ground lost since the high. The question is no longer whether the market has fallen, but whether the low end of the range can absorb another push.
Short positions are paying to stay short
The funding rate was -0.0321% per 8 hours. In a perpetual contract, a contract with no expiry date that tracks the price of Bitcoin, that rate is a payment between the two sides every eight hours. A negative rate means holders of short positions, who gain if the price falls, pay holders of long positions, who gain if it rises.
| Level | Price | Distance from last close |
|---|---|---|
| Last close | $63,037 | — |
| 20-day high | $81,952 | +30.0% |
| 20-day low | $62,018 | −1.6% |
| 20-day average | $72,756 | +15.4% |
| Average daily range | $2,845 | 4.5% |
Open interest, the total value of positions that remain open, stood at $846 million, while 24-hour volume reached $502 million. The venue allows maximum leverage of 200 times, so a position can be far larger than the cash behind it.
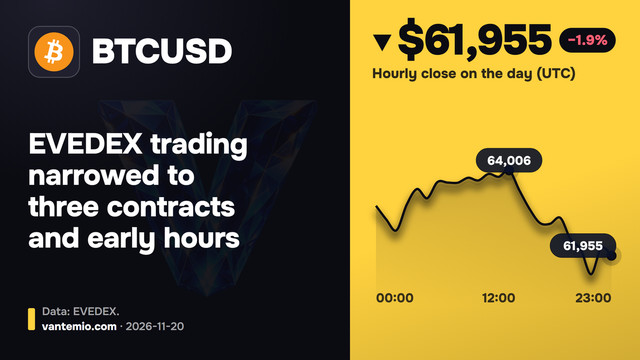
Trading was not thin at the low. The busiest hour, 15:00 UTC, saw $54.1 million traded, and the day's prices ran from $62,040 to $64,977. Over fourteen days the average daily range, from high to low including overnight gaps, was $2,845, or 4.5% of the price. A market moving that far in a typical day can cross its nearby floor without a dramatic single event.
Spot prices confirm the derivatives reading
Coinbase Exchange, which trades Bitcoin itself rather than a contract on its price, gives the same shape to the month. Over thirty days its fall matches the derivatives fall, so the decline is not an artefact of one venue's contract, funding or leverage. That agreement matters because the two markets can diverge when a move is driven mainly by leveraged positions; here they moved together.
That distinction matters for readers in different positions. A person holding Bitcoin itself faces the price fall without funding payments or an expiry date. A person holding the perpetual contract faces the same price fall plus the eight-hour payment, which in this reading runs from short to long. The price is common; the cost of holding a view on it is not.
The picture still comes from a short window. EVEDEX data cover its own BTCUSD perpetual contract, and Coinbase data cover its own spot market, so neither series shows the whole market for Bitcoin. Vantemio, which published this reading from public market data, has a commercial partnership with EVEDEX. The reading is research, not a recommendation to trade, and past prices do not predict future ones. Leveraged contracts can lose more than a trader expects.
The next close will test the floor, not the thesis
Two readings fit the same figures, and they point in opposite directions. One says the payment from short to long, combined with a price pressed against its low, shows the trade betting on falls is crowded and expensive to hold. The other says a price far below its recent average, after steady falls over a week and a month, shows sellers still in control and the low still unproven. The second reading carries more weight in the latest figures, because nothing in them shows buyers stepping in at scale: the fall continued, the range stayed wide, and the close stayed near the bottom.
For anyone who holds, follows or uses Bitcoin, the useful test is concrete. A daily close below the twenty-day low would show the floor giving way, while a close that holds above it, with funding turning positive, would show the payment changing direction. Until one of those readings appears, the evidence points to a market testing its floor rather than leaving it behind.
Not investment advice.<p data-vantemio-partner-disclosure="v1"><em>Disclosure: EVEDEX is a Vantemio partner exchange. Vantemio connects it to its trading terminal through the EVEDEX API and receives part of the trading fee. Disclosure: links to Coinbase on Vantemio are partner links.</em></p>
Source: EVEDEX, Coinbase Exchange, BTC-USD · Date: